To increase utilisation, improve the customer experience, and retain and engage participants (customers), facility network planners and operators need to understand who their current and potential customers are and where they come from. Catchment analysis is a critical component in developing this understanding and underpins effective facility planning and decision-making.
A catchment area is the geographic area that a venue or facility attracts its users/ customers from. Catchment areas can be defined by distance or by travel time e.g drive time and walking time. Travel time analysis is extremely important for understanding how easy it is for customers to access to a location.
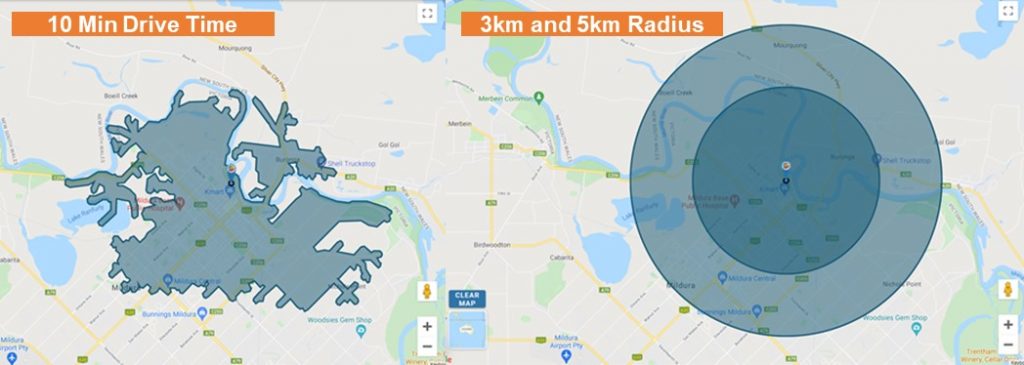
At Kinetica we prefer the use of travel times because it reflects how people access facilities either by foot or transport and accounts for natural boundaries and key arterial routes. This is highlighted in the images below comparing a 10-minute drive time for Mildura Lawn Tennis Club versus 3km and 5km radius. The Murray River creates a natural boundary which is accounted for in the drive time and therefore provides a more realistic catchment than a radius.
Analysis of catchment areas drives the following insights that informs sport and recreation facility planning and decision-making:
- Understand your network coverage: Paint a clear picture of the coverage of your locations, including gaps and overlap. Improve specific facility performance and compare against “competitor” facilities.
- Understand the market potential and penetration: Gain a sense of what the market is like in the region your facilities exist,and determine how likely you are to be successful.
- Select new sites for opening and existing ones for closing: Identify the best sites for a new potential facility and which ones would be the best to close, based on actual performance and catchment potential.
- Determine which locations are performing the best: Use analytics to improve the performance of individual facilities and your entire network.
These insights are critical in developing an effective facilities strategy at a network level, and individualised action plans for specific venues.
Given its power, we have made it our mission to make catchment analysis as accessible and valuable as possible for all sports and recreation planners in sports organisations and government. We have done this in a couple of ways:
1. Generating powerful localised datasets
Our localised intelligence tool called Aura brings together supply and demand metrics for sport and recreation, alongside contextual population, socio-demographic and expenditure data. All of this is available down to the suburb level enabling rich insights into local areas and the catchments of facilities and venues.
2. Utilising software so that anyone can easily run catchment analysis
After an extensive review of available tools to undertake spatial analysis we have an exclusive partnership with a GIS company called GapMaps. GapMaps is used by most of the largest food chains, petrol stations and many large retailers across Australia, and delivers a ridiculously easy to use interface for geographic and spatial analysis. No longer is this just the domain of highly skilled and experienced GIS specialists. If you can point and click you can be a master of spatial analysis.
Check out the video below:
The 5 steps to powerful catchment analysis are:
- Search and select a venue/ facility from the search bar
- Select a drive time or radius
- Hit process to run the catchment analysis and display the catchment on the map
- Click “View report” to see the extensive population, socio demographic, sport and recreation data for that catchment
- Download the report in PDF or CSV to use as you need it
The Aura data and tools make catchment analysis available to anyone at any time. This on-call intelligence means decisions and planning can be done quicker and better. For local government work such as needs assessments, business cases and funding applications are made easier and anchored against real local data. For sports organisations, the Aura intelligence will take your facilities network planning, venue optimisation to a new level and make your business cases and funding propositions stand out..
To find out more about Aura click here http://calendly.com/thekineticagroup/aura-demo-session to book a demo that will include data for your local area or sport. And of course, we are here to answer any questions you have, email me mal@thekineticagroup.com